A Central Bank Sent 200 USDC Around the World. The Blockchain Was the Cheapest Part.
Most claims about stablecoin remittances are built on a comparison that flatters them. Put the on-chain transfer fee next to the World Bank's global average remittance cost of 6.36% and the case looks closed. But the on-chain fee isn't what a remitter pays, and the global average isn't what a well-informed remitter pays either. Both sides of that comparison are wrong, and they're wrong in opposite directions.
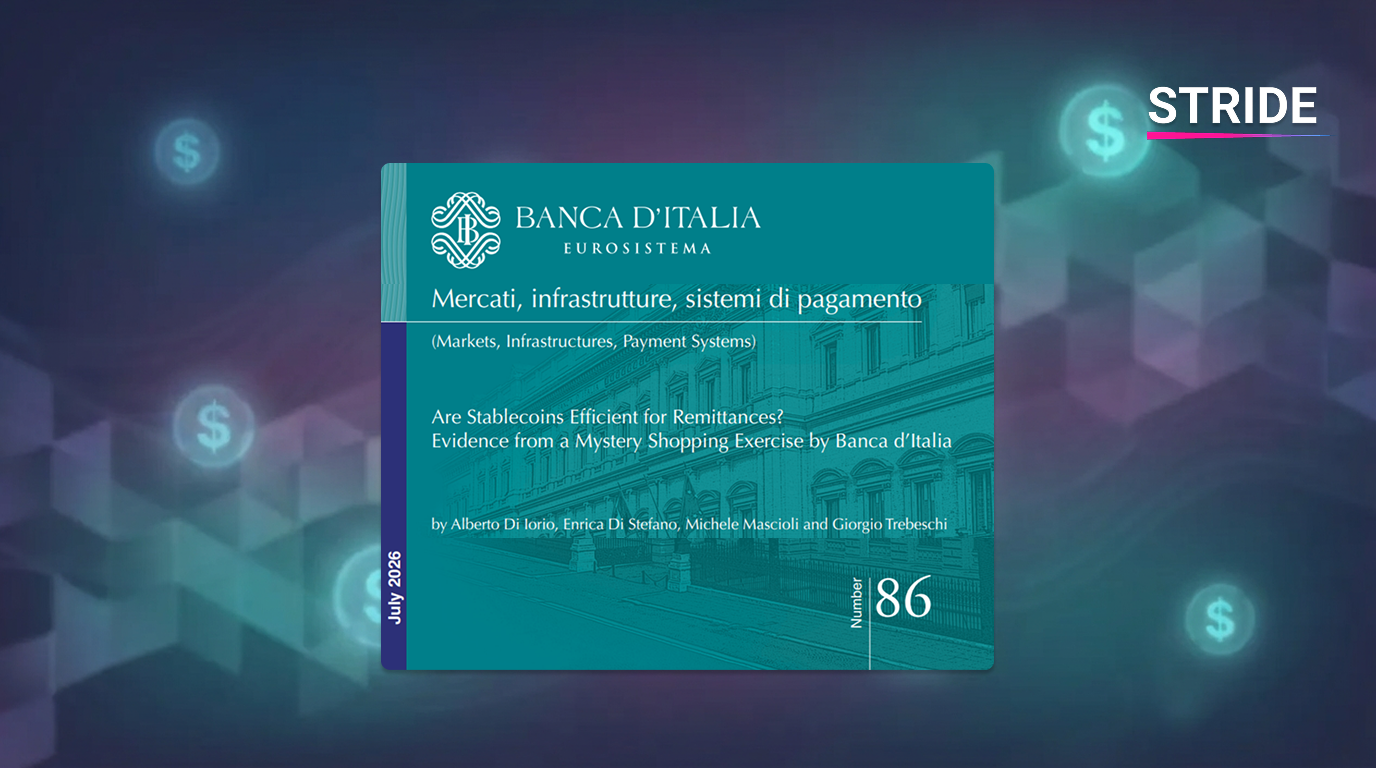
Banca d'Italia has now done the tedious thing that settles the question empirically. In a paper published in July 2026, four researchers used the bank's network of financial attachés and overseas offices to actually send money: 200 USDC across ten corridors linking Italy with Argentina, Brazil, South Africa, the UAE and Japan, tracked phase by phase from the sender's bank account to the recipient's. As far as the authors are aware, it's the first mystery shopping exercise of its kind run by a major central bank.
The headline result is that total costs ranged from 0.30% to 8.96%, which is to say stablecoins have no systematic cost advantage at all. The more useful result is buried in the decomposition, and it changes what the policy conversation should be about.
Why the benchmark question decides the answer
The World Bank's Remittance Prices Worldwide database publishes several averages, and the gap between them is wide enough to determine the verdict on stablecoins before any data is collected.
In its most recent release, covering Q3 2025, the global average cost of sending $200 stood at 6.36%. But the World Bank's SmaRT indicator, which averages the three cheapest qualifying services in each corridor and is meant to reflect what a savvy consumer with good information could pay, came in at 3.29%. Its digital-only MTO index, covering Wise, Remitly, WorldRemit, InstaReM and Xoom, was 3.54%. Banks, at the other end, averaged 14.99%.
So the real question is which of these a stablecoin transfer should be measured against. The Banca d'Italia corridors averaged around 5% and cleared the 3.29% SmaRT bar in only two of eight cases. Measured against the headline global average, stablecoins win most corridors. Measured against what an informed user could already get from a digital MTO, they mostly lose. The paper's authors were careful enough to run both comparisons, and the honest one is the harder one.
The five-phase decomposition, and what it exposes
The exercise broke each transfer into funding, purchase, on-chain transfer, sale and withdrawal, which lets you see exactly where the money goes. This is the structure the industry calls the stablecoin sandwich: a cheap decentralised settlement layer with a fiat conversion at each end.
The settlement layer performed as advertised. The on-chain transfer averaged 0.4% of the transferred amount across all corridors and fell to 0.01% on the Brazil-to-Italy leg. It was under 15 minutes in seven of eight corridors. Ethereum was used throughout, which the authors acknowledge is neither the cheapest nor the fastest available network, and it still wasn't the problem.
Everything expensive happened at the edges. The worst case was the UAE-to-Italy corridor, where the only funding method available to the sender was a payment card carrying a 3.8% surcharge, pushing the all-in cost to roughly 9%. Argentina-to-Italy hit 8.96%, driven by a 5.36% cost at the purchase stage. Withdrawal fees turned out to be operator-specific: some exchanges charge them, some don't, and on a $200 transfer that choice moves the total by percentage points.
Which produces the paper's sharpest practical finding. The variable that determines whether a stablecoin remittance is cheap isn't the token, the chain or the corridor. It's which exchange you happened to sign up with and how you funded the account. That's a financial literacy problem dressed up as a technology story, and it doesn't get solved by better blockchains.
Speed is a property of the destination country, not the network
The execution time data is cleaner than the cost data and, to us, more consequential.
Where both ends of the corridor had a working instant payment system, funding and withdrawal each completed in under a minute and the whole end-to-end transfer finished in under 20 minutes. That held for Italy (TIPS), Brazil (PIX) and Argentina (Transferencias 3.0).
Where the fiat legs relied on standard bank transfers, as in South Africa, the same on-chain transfer sat inside a process that took one to two business days. The blockchain settled in about half an hour. The bank rails ate the rest. End to end, that corridor performed like a conventional wire.
The implication is one that rarely appears in stablecoin marketing: stablecoin remittances and domestic instant payment infrastructure are complements, not substitutes. A country that wants faster inbound stablecoin transfers should invest in its own real-time retail payment system. The stablecoin leg is already fast enough and has been for some time.
This connects to something we've noted before about the 2026 stablecoin market being decided by distribution rather than token design. The Banca d'Italia data is the operational version of that argument. The token performed identically in every corridor. The distribution layer, meaning exchanges, funding instruments and national payment rails, produced a 30x spread in outcomes.
Two caveats the paper is honest about, and which most coverage will drop
Argentina's numbers measure a currency regime, not a payment technology. The cheapest corridor in the whole study, Italy to Argentina at 0.30%, looks that way because the researchers converted at the central bank's official retail rate while the actual USDC-to-peso rate carried roughly a 3% premium. Selling USDC in Buenos Aires yielded more pesos than the official rate implied, producing a negative cost in the sale phase that offset everything upstream. Recalculated at the parallel MEP rate, the same corridor costs 0.5% and the reverse leg drops from 8.96% to 8.5%. What's being measured there is Argentina's exchange rate structure, not stablecoin efficiency.
The sample is small and single-token. Eight comparable corridors, one stablecoin, transactions executed on two days in March 2026 during a period of low Ethereum congestion, with the Wise benchmark run three weeks later. The authors say plainly that the findings can't be generalised to the broader universe of stablecoin remittance arrangements. Anyone quoting the 0.30% or the 8.96% as a general fact about stablecoins is quoting a single observation.
Worth adding: the paper puts the total stablecoin market at around $325 billion as of 31 May 2026. Per DefiLlama data tracked through mid-July, the market has since contracted to roughly $303 billion, its largest drawdown since 2022. That doesn't affect the paper's conclusions, but it's a reminder that any fixed figure in this sector has a short shelf life.
The Japan case is the most instructive part of the paper
Japan had to be handled separately because the exercise couldn't be run normally there. Retail access to dollar-pegged stablecoins is restricted to a single domestic operator, and that operator doesn't permit direct outbound transfers to foreign exchanges. To complete the transfer, the researchers had to route through a self-custody wallet as an intermediate step and fragment the transfer to stay within quantitative limits.
The measured cost was 1.6%, which is competitive. The measured usability was effectively zero for an ordinary retail user.
The paper pairs this with a striking piece of context: Japan's share of global fiat-to-crypto exchange volumes denominated in yen fell from roughly 60% in the mid-2010s to about 4% in 2024. Similar structural effects appear elsewhere in the study. South Korea's requirement that platforms partner with banks for client identification produced a duopoly holding 96% of trading volume. Taiwan's stricter regime cut registered operators from 26 to 9.
The pattern is that regulatory design isn't just a legal perimeter. It determines how many operators exist, therefore how much price competition there is, therefore what a remitter pays. The authors treat regulation as a first-order determinant of transfer efficiency, and the corridor-level data supports it.
What this means for each group
Banks and payment providers. The on and off ramp is where the margin sits, and the paper quantifies it: fiat conversion accounted for essentially all of the cost variance while the settlement layer contributed 0.4%. Institutions already connected to national instant payment systems hold the asset that determines corridor performance.
Central banks and payment system operators. The finding that instant payment infrastructure directly improves stablecoin corridor performance cuts across the usual framing of the two as competitors. The paper raises, without answering, whether stablecoin routes could become an alternative to bilateral interlinking of domestic instant payment systems, currently the leading policy response to cross-border payment friction.
Regulators. The paper's taxonomy sorts jurisdictions into purpose-built frameworks, transitional or indirectly regulated regimes, and prohibitionist ones, and finds that the restrictive end produces migration to offshore platforms and self-custody rather than reduced demand. For teams tracking where individual jurisdictions currently sit across these categories, our free Stablecoin Regulation Tracker maps licensing regimes and frameworks across 200+ markets.
Exchanges and wallet providers. Withdrawal fees, funding method availability and deposit charges were the decisive variables in this study. In corridors where card funding is the only option, the surcharge alone can exceed the entire cost of a traditional MTO transfer.
Emerging market policymakers. The paper closes on a tension worth sitting with. The single largest efficiency gain available would come from removing the off-ramp entirely, letting recipients spend stablecoins directly on rent, school fees and goods. That's also the scenario with the clearest currency substitution implications, particularly in economies where dollar demand is already high.
The takeaway
The useful reframe from this paper is that a stablecoin remittance is not a blockchain transaction. It's a bank transfer, an exchange trade, a blockchain transaction, another exchange trade and another bank transfer, and four of those five steps run on conventional infrastructure priced by conventional intermediaries.
Which means the efficiency debate has been aimed at the wrong layer. Faster chains and cheaper gas address 0.4% of the problem. The other 99.6% is a question of how many licensed operators a jurisdiction permits, whether they can connect to a real-time payment system, and what they choose to charge for a withdrawal. The Bank of Italy's own financial intelligence unit made a structurally similar argument earlier this year about privacy, locating the solution in system design rather than in the properties of the asset.
The instinct to treat stablecoins as either the answer to cross-border payments or a threat to be contained both miss what this data shows. The token worked fine in all ten corridors. The question is what it was plugged into at each end.
Source: "Are Stablecoins Efficient for Remittances? Evidence from a Mystery Shopping Exercise by Banca d'Italia," by Alberto Di Iorio, Enrica Di Stefano, Michele Mascioli and Giorgio Trebeschi. Banca d'Italia, Markets, Infrastructures, Payment Systems series, Number 86, July 2026. The views in that paper are the authors' and do not necessarily reflect those of Banca d'Italia.
World Bank remittance cost benchmarks (global average 6.36%, SmaRT average 3.29%, digital-only MTO index 3.54%, bank average 14.99%) are from Remittance Prices Worldwide Issue 54, covering Q3 2025. Stablecoin market capitalisation figures for July 2026 are from DefiLlama data as reported by Stablecoin Beat.
Methodology note: we focused on the cost decomposition, execution time results and regulatory framework sections, and on the benchmark selection problem underlying the paper's comparisons, rather than summarising the paper section by section.
This article is for informational purposes only and does not constitute financial, investment, or legal advice.