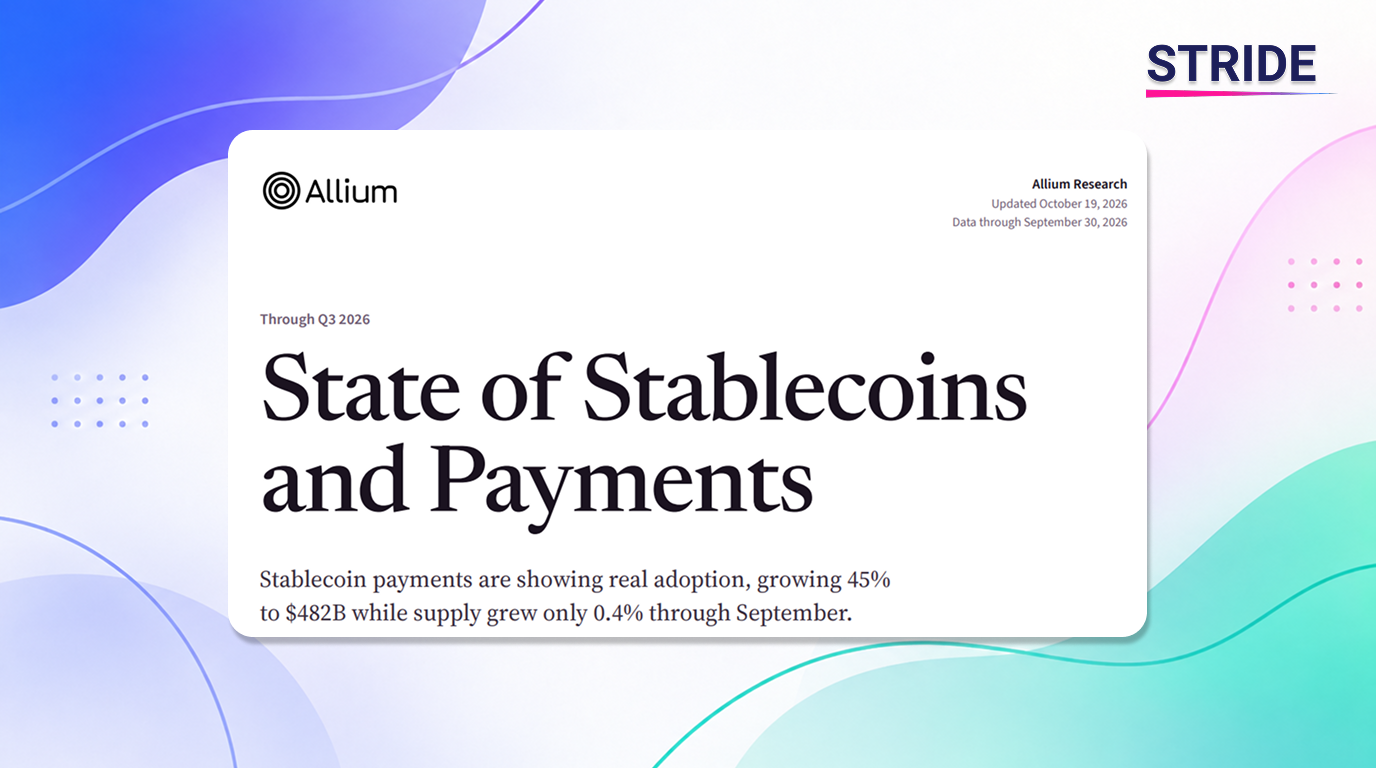
Stablecoin Supply Grew 0.4% This Year. Payments Grew 45%.
For most of the last two years, the stablecoin story has been told in one number: how many tokens exist. Supply crossed $200 billion, then $300 billion, and each milestone was read as adoption.
This year that number stopped moving. According to Allium's new State of Stablecoins and Payments report, total supply stood at $304.9 billion on 30 September 2026, up just 0.4% since the start of the year. Over the same nine months of 2025 it had grown 45%.
What did move was use. Payments classified by Allium reached $482 billion from January to September, up 45% on a year earlier, and the number of payment transfers rose 71% to 1.04 billion. The float barely changed; what flowed through it grew by almost half.
That shift is the most useful thing in the report, and it comes with an equally useful caveat about how the numbers are built. We've focused on both: what the decoupling of supply and use tells institutions, and what the measurement funnel says about how much of the headline activity is real.
Why this matters now
The flat supply figure lines up with what the Financial Stability Board reported last week, when its note put the market at around $300 billion, essentially unchanged on a year earlier. When we looked at that note, we pointed out that some DefiLlama-based figures implied much faster growth, as an example of how hard it is to measure this market consistently. Allium's year-on-year series, from $294.0 billion to $304.9 billion, sits close to the FSB's view. It also offers one likely reason sources differ: Allium counts each dollar once, leaving out coins that are themselves backed by other stablecoins.
On the payments side, there is an independent reference point. McKinsey and Artemis Analytics, in work published in February 2026, estimated actual stablecoin payments at about $390 billion a year, annualised from December 2025 activity, or roughly 0.02% of global payment volumes. The methods differ from Allium's and the figures should not be compared directly, but both land in the same place: real payment activity is in the hundreds of billions, a small fraction of headline transfer volume.
Most of what moves is not a payment
The report's methodology page is where the story becomes credible.
Every stablecoin transfer recorded on-chain from January to September 2026 adds up to $97.9 trillion. Allium then removes six categories of activity that are not end users moving money: automated and high-volume senders, issuance and redemption, routing through intermediate wallets, bridges and administrative transfers, DeFi swaps and lending, and exchange transfers. What remains, which it calls adjusted volume, is $2.4 trillion, or 2.5% of the raw total. Of that, $482 billion is classified as payments.
Put another way, the widely quoted transfer totals are roughly 200 times actual payment activity. The raw figure more than doubled this year, up 133%, while adjusted volume grew 48%. Most of the gap is automation and trading-venue traffic.
Allium is direct about the limits of its own numbers. Public blockchains record amounts, dates and addresses, but not ownership or intent, so every classification is inferred from observed behaviour and describes activity rather than confirmed identity or purpose. Its labels and heuristics are updated continuously, which can revise historical figures. These are carefully built estimates, not a ledger of verified payments.
Use is spreading through more, smaller transfers
The composition of growth matters as much as the total.
Adjusted transfer count grew 71% against 48% for value, bringing the average transfer down 14%. In payments, the average fell from $544 to $462. The report reads this as a broader user base, more frequent use, or both.
The split by counterparty shows two lanes maturing in opposite directions. Consumer-to-business payments nearly doubled in count while their average size fell 28%, which is what more frequent everyday use looks like. Business-to-business payments went the other way: value grew faster than count, so the average B2B payment got larger. Transfers between consumers were the largest category by count and the fastest-growing by value, but payments with a business on at least one side still carried 64% of payment value on 36% of payment count.
Network costs are not holding this back. Average transaction fees fell on six of the seven networks with comparable data, and by September seven of the eight networks shown averaged under a cent. The report notes that this is only the network fee; conversion, custody and provider charges add to what a customer actually pays.
Growth is broad. Concentration is not changing.
Activity is spreading across chains without displacing the leaders. Adjusted volume grew on all seven major networks, and volume outside Tron grew 56%, faster than Tron's 44%. Solana more than doubled, Polygon nearly did, and newer payment-focused networks such as Plasma and Tempo are scaling from small bases.
But Tron still carried two-thirds of payment value, $321 billion, and accounted for 60% of the year's increase. USDT settled $406 billion of the $482 billion in payments, 84% of value, with USDC at $60 billion. Both grew roughly in line with the market. On payment use, the market is broadening at the edges while its centre stays where it was.
Supply growth moved away from the two largest issuers
Underneath the flat total, the issuer mix shifted. In the first nine months of 2025, Tether, Circle and Ethena added $79 billion between them, 86% of the market's increase. Over the same months of 2026, Tether's supply fell $3.1 billion, Ethena's $1.8 billion and Circle's around $0.9 billion. Other issuers grew enough to offset that, and 15 issuers now have more than $1 billion outstanding, up from 11.
The new entrants that grew fastest tend to have something in common: an existing customer base. The report highlights two distribution models built around that. Open USD, issued by Bridge through Open Standard, whose founding partners include Coinbase, Mastercard, Shopify, Stripe and Visa, passes almost all reserve income to partners and lets them earn equity based on the supply and activity they bring; it reached $799 million within two weeks of its 30 September launch. Branded stablecoins take a different route, letting a company such as Polymarket issue its own coin backed one-to-one by an existing one, so the brand keeps the customer relationship while the underlying issuer gains demand. These reached $872 million in supply.
Both are distribution arrangements more than new money. It is the same pattern we described when we called the 2026 market one ruled by distribution rather than token design: issuers now compete for access to other companies' customers. Bank and asset-manager stablecoins remain small by comparison, adding about $0.7 billion between them, though they extend participation beyond specialist issuers.
Two new channels, measured honestly
Cards are growing fast from a small base. Stablecoin card spend visible in Allium's data rose tenfold to $3.9 billion. The merchant is paid in local currency through Visa or Mastercard and never touches a stablecoin, which means this growth depends on card programmes and issuers rather than merchant adoption. Purchases under $50 drove 84% of the increase in visible card purchases. Two caveats keep the number in proportion. Allium says its total is a floor, because some programmes' spend is not visible on-chain. And card spend from April to June 2026 was equal to 0.03% of the $4.0 trillion Visa processed over those months.
Agent payments are growing in count, not in value. AI agents made 68.3 million stablecoin payments to online services in Q3 through the x402 and MPP protocols, double the previous quarter, but spending fell slightly to $3.7 million. The median payment in September was 0.31 cents, far below a card's fixed fee, which is exactly why these micro-purchases of data, model answers and tools need a near-zero-cost rail. The report's own conclusion is measured: activity is growing faster than the revenue it generates, and moving beyond experimentation will require growth in dollars spent.
What we cannot see yet
The report includes a domestic versus cross-border split, and it is interesting: cross-border transfers made up 34 to 42% of payment value involving businesses, against 22% between consumers. But Allium is careful to say this covers only unhosted wallets with locations assigned at both ends, a 3% sample of payment value.
That is the FSB's attribution problem in numbers. Even a specialist data provider combining on-chain labels with off-chain data can locate both ends of only a small share of payments. Any claim about how much of the stablecoin market is cross-border should be read with that in mind.
What follows for each group
Banks. Activity growing while supply stays flat suggests the competitive question is shifting from who holds stablecoin balances to who processes the flows. Most payment value involves a business, and B2B payments are getting larger, which is the segment where banks already hold the relationships.
Issuers. Growth this year came from issuers with distribution attached, through partner economics, branded coins or existing customer bases. The report notes that rising supply alone does not show how actively a coin is used, so payment activity is becoming the more meaningful measure of traction.
Payment companies. Cards show that stablecoin balances can reach everyday merchants without asking those merchants to change anything. Agents show the opposite end: a use case that only works because per-transaction costs are close to zero.
Regulators and analysts. The gap between raw and adjusted volume is a reminder to ask how any headline stablecoin figure was built. Different methodologies for supply, volume and geography produce materially different pictures, and the report's own geography sample covers 3% of payment value. Tracking how jurisdictions are setting the rules that will shape this activity is part of why we maintain the free Stablecoin Regulation Tracker across 200+ markets.
Measuring the right thing
The most important shift in this report is not a number. It is a change in which number deserves attention.
Supply measures how much money has been parked in stablecoins. Payments measure how often it is used. In 2026 the first stalled and the second grew by nearly half, which suggests the market has moved from accumulating balances to using them. That is a healthier sign of adoption than another supply milestone would have been.
It also raises the standard for the evidence. If use is now the story, the industry needs measures of use that are transparent about what they leave out. This report sets a reasonable bar: it shows the $97.9 trillion, explains how it becomes $482 billion, and tells readers when a figure rests on a 3% sample. Not every headline figure in this market does.
Source: State of Stablecoins and Payments, Q3 2026, Allium Research, October 2026, with data through 30 September 2026. Authored by Elton Shehdula, Maksym Sherman and Olivia Denk, with contributor commentary from organisations including Visa, Stripe, Coinbase, Stellar, TRON, BVNK, Tempo and Moody's. Adjusted volume, payment classification and geographic attribution are proprietary Allium metrics.
Additional data: McKinsey and Artemis Analytics estimate of about $390 billion in annual stablecoin payments, annualised from December 2025 activity, from McKinsey's Stablecoins in payments: What the raw transaction numbers miss, published 18 February 2026.
Methodology: We focused on the relationship between supply and payment activity, the report's raw-to-adjusted volume funnel, and its stated coverage limits. Contributor commentary is treated as outlook rather than evidence. The comparison between Allium's supply series and the FSB's market figure is ours.
This article is for informational purposes only and does not constitute financial, investment, or legal advice.